Kibana 4 Tutorial – Part 4: Dashboard
This is part 4 of the tutorial series about Kibana 4. In Kibana 3 dashboards were used to create all graphs on and save queries in different colors and show tabular view of the data. In Kibana 4 as we’ve seen in the previous part of this tutorial, all graphics are visualizations, that are stored one by another. A dashboard is just a place to put several of these visualizations and arrange them. This has many advantages, e.g. you can easily use a visualization on multiple dashboard, without the need to copy code around. If you edit the visualization it will be changing automatically on every dashboard you use it. When opening the Dashboard tab the first time we will have an empty dashboard, ready to be arranged with our visualizations.
Placing visualizations
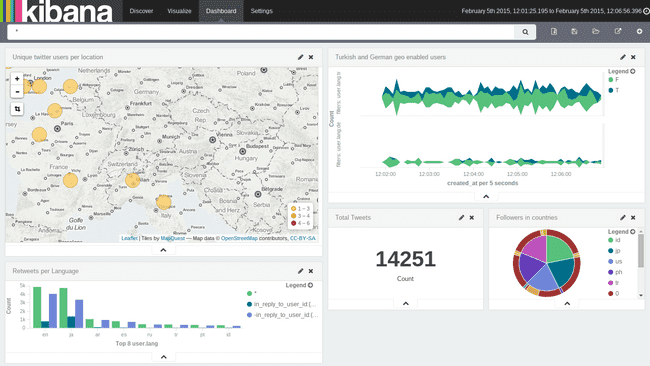
To add a new visualization press the + button in a circle (the right most button) beside the query input box. A panel with a list of all your visualizations will be expanded. You can use the filter on the top to search for a special one, or just browse through the list until you found one. Let’s chose any of them and click on it, to add it to the dashboard. You will see a box with that visualization apprearing on the dashboard. You can use the top right corner of the box to resize the box to the desired size. You can also move around the box by grabbing it at the title bar. If you want to remove the box again (this won’t delete the visualization itself) just press the small x in the upper right corner. By hitting the pencil beside the x, you will jump to the visualize editor for this visualization. Try to place several of your visualizations on the dashboard and arrange them in a way you like. You will quickly notice, that some of the visualizations need some space to display their content, and will just display a warning, when you resize them too small. At the end you can have a dashboard like the following:
Placing Searches
Besides adding visualizations, you can also place the tabular output for a specific filter (i.e. what you saved under Discover) to the dashboard. After clicking the add button you can switch to the tab Searches. Just select any search you saved on the Discover page and it will be added to the dashboard as well.
Saving/Loading dashboards
Once you finished arranging all the visualizations, you can use the save button on the top right to give the dashboard a name and store it. Same with visualizations and the discover tab: when you make changes to the dashboard, you need to press save again to store these changes permanently. You can load dashboards by pressing the loading button and select the desired dashboard.
Queries in dashboards
Same as with all other screens, you can use the query language to enter queries in the top search box. The data for all visualizations placed in the dashboard will be filtered by this query before aggregation. If you have stored a query with a visualization (as described in the previous tutorial part), both queries will apply. So you can use the dashboard search box to quickly filter out data you want to aggregate, without destroying any filter logic inside the visualization. If you change the time interval on your dashboard (on the top right side) this will of course also apply to every visualization on the dashboard.
Sharing Dashboards
Same as in Kibana 3 you can press the share link (beside the Add Visualizations) to get some links that you can share around. There is an embed html snippet available at the top. If you copy out the link written in the src=”..” attribute and share this, your users won’t have the option to modify the dashboard. This is not a security feature, since a user can just remove the embed from the URL. But it might be handy, if you want to share links to people, that should not modify the dashboards by accident.
Résumé
The basic tutorial series about Kibana 4 ends here. We’ve seen how to use the Discover view, how to create visualizations and how to arrange dashboards. If you liked the tutorial, feel free to share it. If you think there some information is lacking or find some wrong descriptions, please leave a comment under the appropriate post. Kibana 4 has more to offer, than what has been covered in this tutorial. There might be some additional tutorials following on some more specific features, like scripted fields or such.

